Building Permits in 2018 report
Building Permits in 2018 report. How it affected our property taxes? The report for the year end building permits for 2018 came out on the February 11, 2019 meeting. When council set the property tax increase for the amount that they did they mentioned that is was because they didn’t have the commercial building permits that they were expecting to offset the residential tax cost that is needed to create a balanced budget. With the report we are able to see this exactly as there is a direct comparison from 2017 to 2018 in the information item that was presented.
The following is an except from the meeting minutes that as presented by Ken Woitt Director of Planning and Economic Development and Prepared by Fiona Paquet, Development Officer.
BACKGROUND KEY ISSUE(S) I CONTEXT:
In 2018 the City experienced a decrease in the building permit activity from 2017. The number of permits issued in 2018 decreased from 866 in 2017 to 777 permits issued and the total permit value for 2018 decreased by approximately 20% ($160.8 M to $128.9 M).
New residential dwelling units increased slightly this year from 325 in 2017 to 349 in 2018. In 2018, 192 single detached dwellings were constructed compared to 181 constructed in 2017, and the construction of multi-family residential units increased from 144 in 2017 to 157 in 2018. The multi-residential dwellings in 2018 included street-fronting duplexes totaling 63 units and tri-plex, 4-plex and row housing totaling 94 units. In 2018, permit value for new residential development increased from $103.2 M in 2017 to $107.7 M. Total permit value for residential accessory structures, including sheds, garages, residential additions and alterations also increased in 2018 from $7.5 Min 2017 to $8.2 M.
In 2018, the number of new industrial building permits decreased from 4 permits issued in 2017 to 1 permit issued in 2018. Permits for Industrial additions, alterations and accessory structure permits were slightly decreased from last year from 30 to 21 permits issued in 2018. The permit value for new industrial buildings decreased significantly from $31.3 Min 2017 to $1 .0 M in 2018. Permit values for industrial additions, alterations and accessory structures increased from $2.9 M to $3.8 M in 2018. The total permit value for all industrial development decreased from $34.2 M in 2017 to $4.6 M in 2018.
Major industrial development in 2018 included:
Industrial Building with warehouse/shop/office – Leduc Business Park
2018 did not attract any new commercial builds versus the 5 that were issued in 2017. Commercial additions, alterations and accessory structure permits also decreased from 51 issued in 2017 to 34 issued in 2018.
The permit values decreased from $7.0 Min 2017 to $3.5 Min 2018. The total permit value for all commercial development decreased from $10.7 Min 2017 to $3.5 M in 2018.
Overall the City of Leduc experienced a significant decrease in value of commercial and industrial development by 82% from $45.0 Min 2017 to $8.2 Min 2018.
In 2018, there was 2 new government/institutional building permits. Government/institutional additions, alterations and accessory structures permits decreased from 23 permits issued in 2017 to 15 permits in 2018. In 2018, total value of government/institutional permits decreased slightly from $5.0 Min 2017 to $4.6 M in 2018
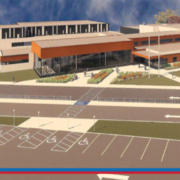
Outdoor Recreational Facility – Ice Rink – Black Stone
Sanitary Lift Station – Woodbend
FINANCIAL IMPLICATION: The revenue generated by all building permit fees in 2018 decreased approximately by 20% from $160.8 M for 2017 to $128.9 M.
CONCLUSION: In 2018, the City experienced an increase in residential development for new single family residential, duplex and multi-family development. The total number of new industrial and commercial permits decreased to almost zero and the value of these permits then decreased in 2018 from $34.9 Min 2017 to $8.2 M.
The amount of Government institutional new, additions and alterations permits and values decreased in 2018. According to our records, there are currently 280 vacant serviced residential lots available within Black Stone, Bridgeport, Deer Valley, Meadowview, Tribute, West Haven Estates, Suntree, Windrose, Southfork, Robinson and Woodbend subdivisions.
Click here to view the COUNCIL MINUTES.
When you look at the number of residential new builds that are coming up and the amount of resale houses as well that are being listed. It looks like there will be a saturation of the market with houses for sale. In a market that is based on basic rules of supply and demand I would imagine that we are heading into another year of the same.
One thing to note, on the report there is a table and it shows the type of houses and where they are in regards to their status, and there is more zero lot lines properties being built then single detached. So when buying make sure that you chat with your Realtor on the pros and cons of this and what it will mean to you as a homeowner.
It is great to see that Leduc is growing in all directions, we have houses in all our surrounding areas. Now if we can just get the a small commercial center in every neighborhood that would be amazing. Lets work together to make Leduc a walkable town.
Thanks for reading this blog “Building Permits in 2018 report”, if you like what you read don’t forget to subscribe to my newsletter or my YouTube channel so you don’t miss out on anymore growth and happenings in this vibrate city of Leduc.
